0%

所思即所得,一些画图软件(包)介绍

由于我在学习控制系统的时候,感觉Visio绘图手感像坨屎(我承认是我手不行),但是像流程图这样的东西有特点,即如果你能在这些空间里面把你想要塞的东西全部塞进去,那么优化这样的工作可以是完全交由计算机自行处理的.

在这里,我主要将介绍两种方式进行该类绘图,一种是使用LaTextikz包进行绘图,还有一种是使用Graphviz进行绘图

tikz包的使用与导出

tikz包是在LaTex中的一个包,其可以方便(有模板的条件下)实现图的绘制

不过LaTex主要导出的是pdf文件,因此需要进行转换

tikz包的使用(以一个例子为例)

我们首先以一个官方例子来介绍tikz

1
2
3
4
5
6
7
8
9
10
11
12
13
14
15
16
17
18
19
20
21
22
23
24
25
26
27
28
29
30
31
32
33
34
35
36
37
38
\documentclass{article}  
\usepackage{tikz}
\usetikzlibrary{shapes,arrows}

\begin{document}


\tikzstyle{block} = [draw, fill=blue!20, rectangle,
minimum height=3em, minimum width=6em]
\tikzstyle{sum} = [draw, fill=blue!20, circle, node distance=1cm]
\tikzstyle{input} = [coordinate]
\tikzstyle{output} = [coordinate]
\tikzstyle{pinstyle} = [pin edge={to-,thin,black}]

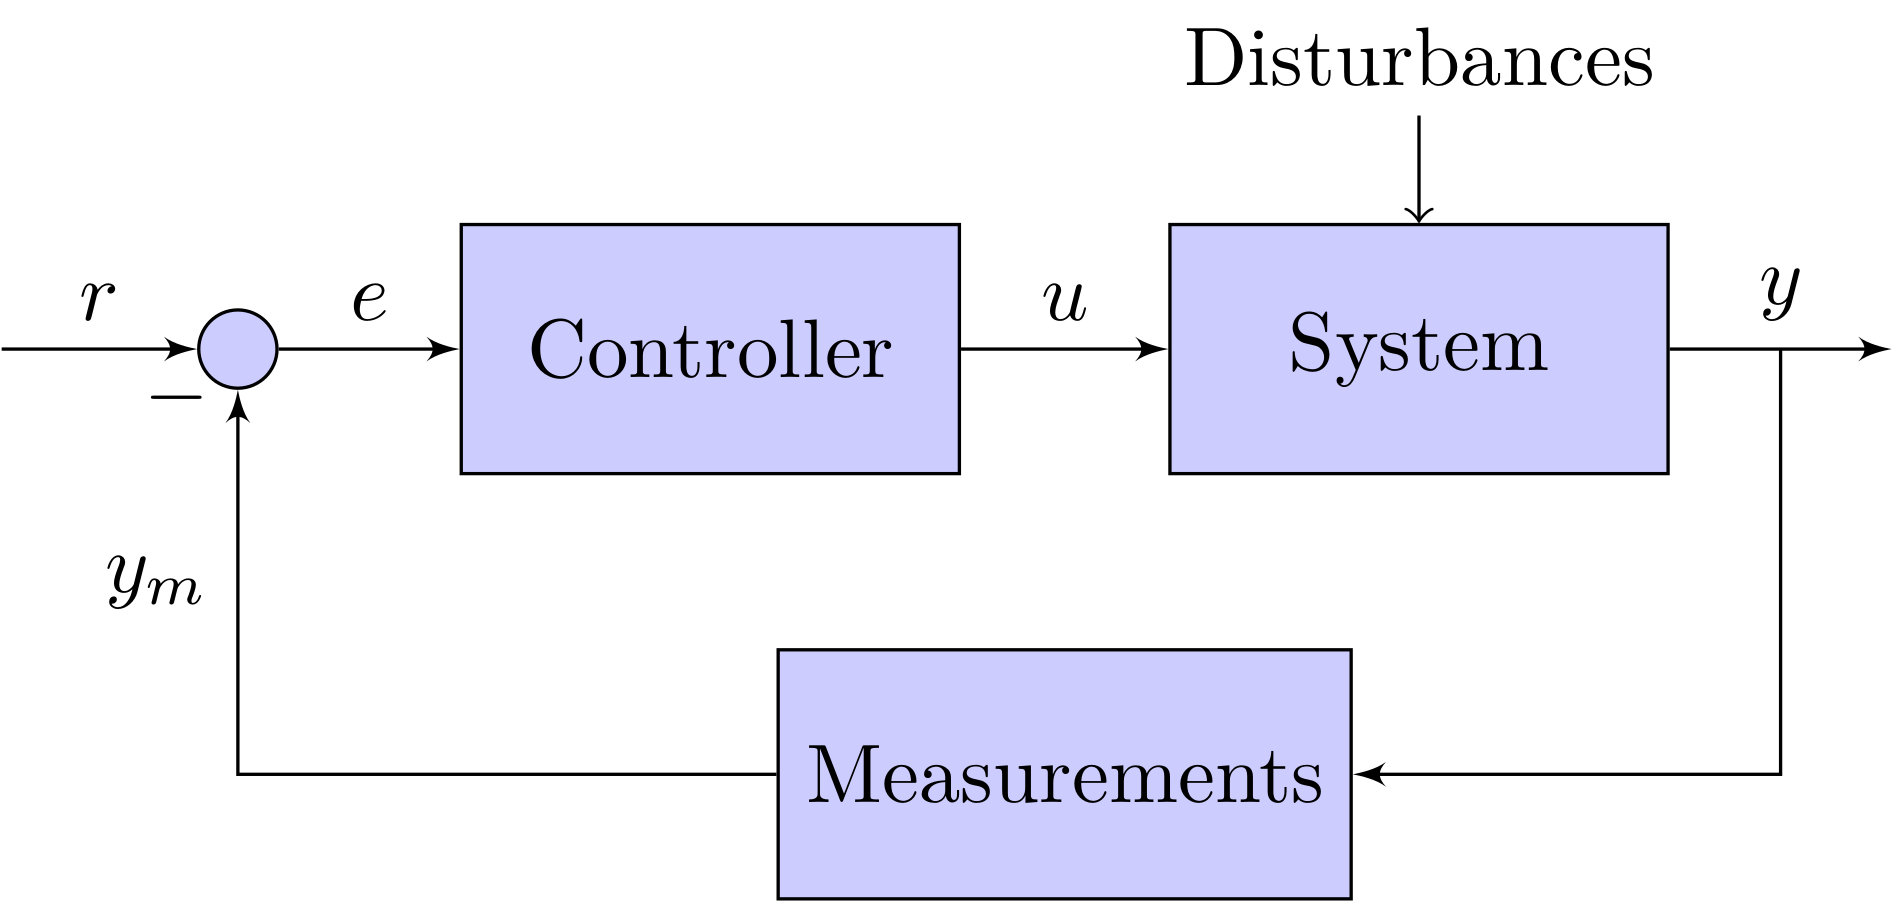
% The block diagram code is probably more verbose than necessary
\begin{tikzpicture}[auto, node distance=2cm,>=latex']
% We start by placing the blocks
\node [input, name=input] {};
\node [sum, right of=input] (sum) {};
\node [block, right of=sum] (controller) {Controller};
\node [block, right of=controller, pin={[pinstyle]above:Disturbances},
node distance=3cm] (system) {System};
% We draw an edge between the controller and system block to
% calculate the coordinate u. We need it to place the measurement block.
\draw [->] (controller) -- node[name=u] {$u$} (system);
\node [output, right of=system] (output) {};
\node [block, below of=u] (measurements) {Measurements};

% Once the nodes are placed, connecting them is easy.
\draw [->] (input) -- node {$r$} (sum);
\draw [->] (sum) -- node {$e$} (controller);
\draw [->] (system) -- node [name=y] {$y$}(output);
\draw [->] (y) |- (measurements);
\draw [->] (measurements) -| node[pos=0.99] {$-$}
node [near end] {$y_m$} (sum);
\end{tikzpicture}

\end{document}

以上代码会带来以下的渲染结果:

test-1

我们来分段介绍内容

节点node

节点可以看作骨架,应当是最为基础的部分

node有三种定义方式:

  1. 使用\node定义,这里的定义方式应当为\node [style and place] (name) {label}
  2. draw中定义,这种定义往往是用于在线上写字-- node [name and position] {label}
  3. 使用pin定义

然后关于位置,pos应该是线的位置,越大越靠近终点

箭头draw

\draw [->] (nodefrom) -- (nodeto)

直接在两个中间添加一个箭头(中间可以添加新节点)

\draw [->] (nodefrom) -| (nodeto)

这个箭头是折线

样式

这里我们就直接套用好了没有必要去修改

应用举例

下面我以控制系统中的一幅框图来实践刚才的知识(只保留)主干部分代码

1
2
3
4
5
6
7
8
9
10
11
12
13
14
15
16
17
18
19
20
\begin{tikzpicture}[auto, node distance=2cm,>=latex']
\node [input] (input) {};
\node [sum, right of=input] (sum1) {};
\node [block, right of=sum1] (controlp) {$k_P$};
\node [sum, right of=controlp,node distance=2cm] (sum2) {};
\node [input, above of=sum2] (dis) {};
\node [block ,right of=sum2] (p) {$\mathcal{P}$};
\node [output, right of=p] (output) {};

\node [output, below of=sum2] (ins) {};

\draw [->] (input) -- node {$r$} (sum1);
\draw [->] (sum1) -- node {$e$} (controlp);
\draw [->] (controlp) -- node {$u$} node[pos=0.99] {+} (sum2);
\draw [->] (dis) -- node {$d$} node[pos=0.99] {+} (sum2);
\draw [->] (sum2) -- (p);
\draw [->] (p) -- node[name=y] {$y$} (output);
\draw [-] (y) |- (ins);%中间切断了一下
\draw [->] (ins) -| node[pos=0.99] {-} (sum1);
\end{tikzpicture}

其渲染结果如下所示:

image-20230127220705981

可以看到渲染效果不错

但是敲tikz太累人

这里主要是介绍性使用tikz,更加完备的教程应当参考这个仓库

导出

目前来说,我觉得还是截图保存的方式最便捷

虽然确实可以用LaTex直接导出,也可以用python对pdf进行转换,但是太麻烦,还是截图方便